Bring your survey results to life
DATAVIV’: the solution that combines Statistics, Data visualization and Reporting
REQUEST A DEMOGet ready to convince!

ANALYZE: Explore quantative and qualitative data
Process and understand all data (surveys, customer reviews, CRM etc.) using statistics and textmining

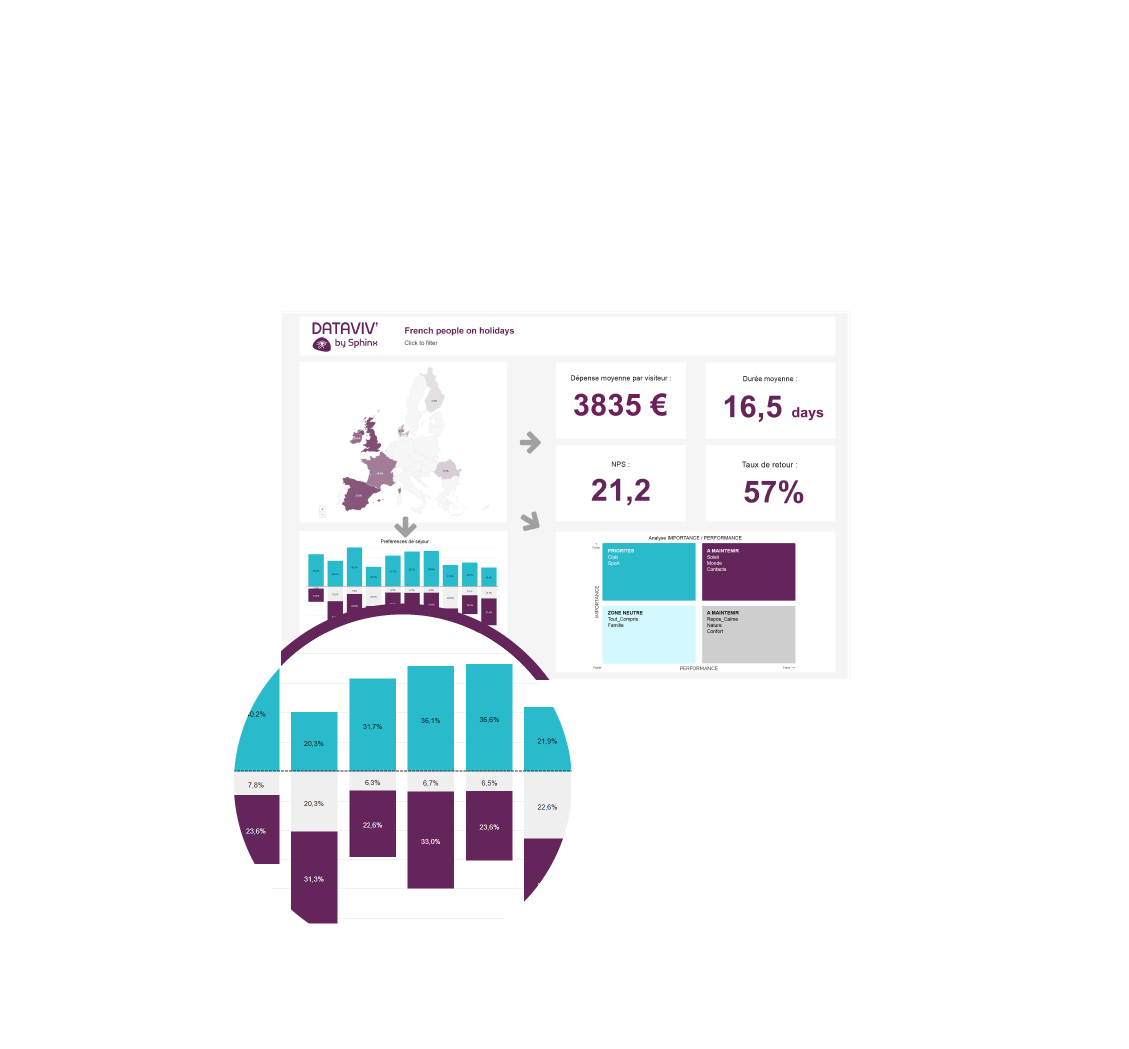
REVEAL: Make it meaningful with data visualization
A wide range of graphical representations available (infographics, mapping, word clouds etc.)

SHARE: Communicate reporting in a few clicks
Real-time dashboards and online platforms: dynamic and interactive results to involve readers
Research analysts, managers, academics: try the DATAVIV' experience!

Over 30 years of experience
in surveys and the analysis of survey data

A dedicated support team
for your projects

A special relationship
with the Research and Teaching sectors
Sign up to test DATAVIV'!

Free 15 day trial

Use your own data
