Analyze, Reveal, Share
DATAVIV' software: a large range of features, from statistics to infographics
REQUEST A DEMOANALYZE: Explore quanti and quali data
Importing and managing data
Import data effortlessly from all sources: Excel files, CSV, Triple S, SPSS, SurveyMonkey, Google Forms, etc., or connect to our APIs to create data flows in real time and feed dashboards.
Statistical analysis
Make data speak by mobilizing all the DATAVIV' methods of analysis. Carry out crossovers in a few clicks: flat sorting, cross sorting, multivariate analyses, strengths/weaknesses matrices, etc. Develop understanding using statistical tests: Chi2, correlation, Student, Fisher, confidence interval.
Textual analysis
Exploit all the richness of verbatim using lexical and semantic analysis: rapid identification of themes, orientation and feelings analyses,… the power of the automatic treatment of natural language in DATAVIV’ for a quick and complete vision of textual content.
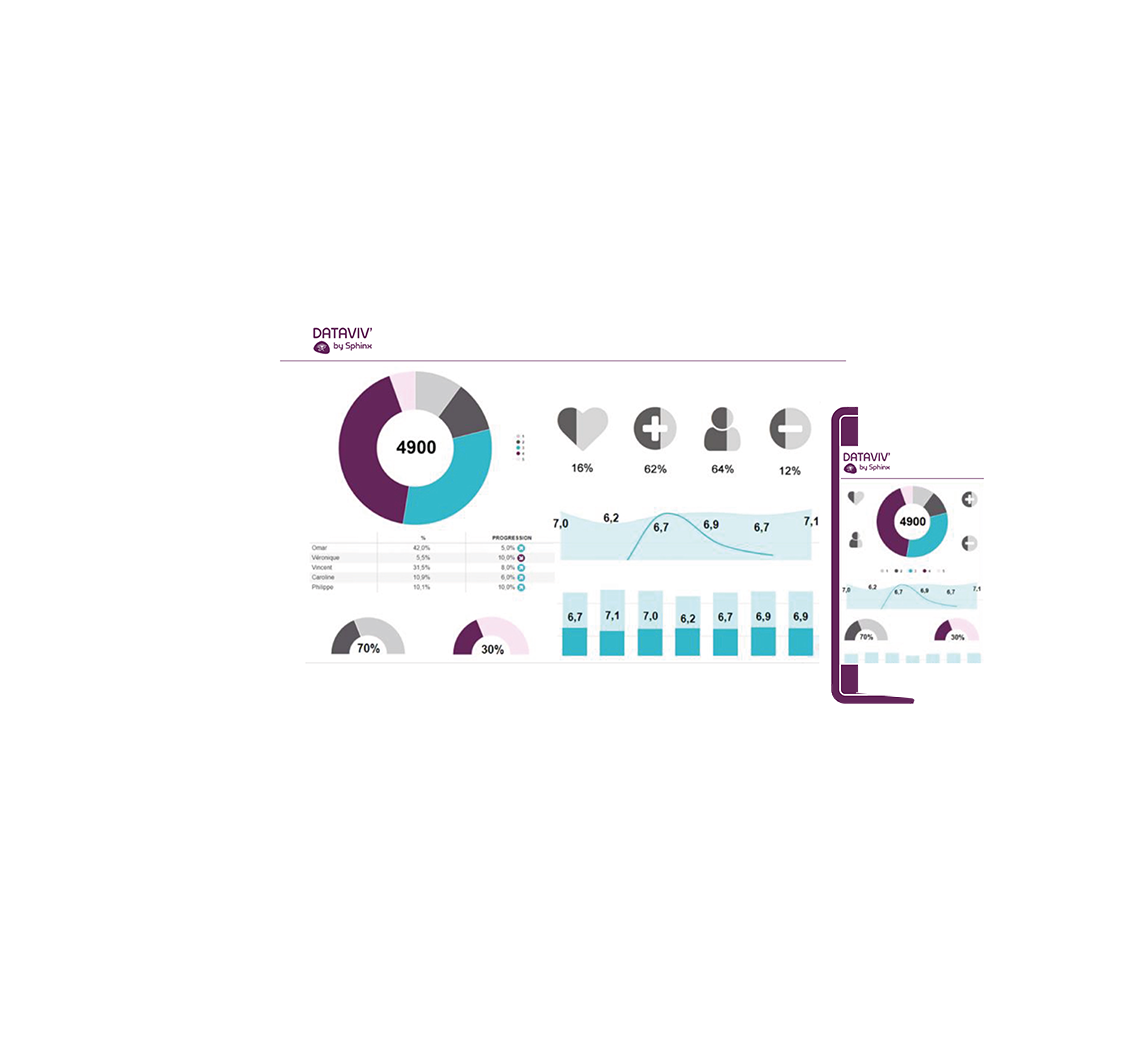
Reveal: Make it meaningful with data visualization
Data visualization
Present powerful messages with clear indicators, geographical maps and a wide choice of custom design graphics: heat maps, bubble charts, tree maps, compasses, fillable images, interactive word clouds.
Storytelling results
Catch attention by scripting results in a few clicks: filters, additional analyses to refine or illustrate results, automatic highlighting of important elements, comments in overview.
Interactive infography
Transmit messages through dynamic drag and drop graphics: access to a large library of pictograms and image bank, text insertion, etc… become a graphic designer using our library of ready-to-use models.
SHARE: Communicate reporting in a few clicks
Dashboards & reports
Communicate results in the most suitable formats: innovative online reporting with personalized access, full responsive design dashboards, export of reports to PowerPoint, Word, PDF, CSV, Open Office. We also ensure compatibility between all these formats.
Real time
Track results at all times with automatically updated calculations. Plug in data for on-the-go analyses with an API connection and present operational dashboards to managers.
Interactivity
Share results and reach out to readers with innovative online platforms with personalized filters. Readers can manipulate and explore results concerning them and export key elements independently.
Sign up to test DATAVIV'!

Free 15 day trial

Use your own data
